Dataja:European Output of Books 500–1800.png

Seiteninhalte werden in anderen Sprachen nicht unterstützt.
z Wikisłownika

Originalna dataja(1.436 × 953 pikselow, wulkosć dataje: 64 kB, typ MIME: image/png)

Tuta dataja je z Wikimedia Commons a da so přez druhe projekty wužiwać. Wopisanje na jeje stronje datajoweho wopisanja so deleka pokazuje.

Zjeće

wopis
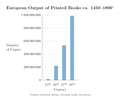
Deutsch: Geschätzte europäische Buchproduktion von 500 bis 1800. Bei den Manuskripten sind einzelne Urkunden und Chartas nicht berücksichtigt. Ein gedrucktes Buch ist definiert als ein Druckwerk von mehr als 49 Seiten.
English: Estimated European output of books from 500 to 1800. Manuscripts do not include individual deeds and charters. A printed book is defined as printed matter containing more than 49 pages.
datum
žórło

Swójske dźěło

Data from: Buringh, Eltjo; van Zanden, Jan Luiten: "Charting the “Rise of the West”: Manuscripts and Printed Books in Europe, A Long-Term Perspective from the Sixth through Eighteenth Centuries", The Journal of Economic History, Vol. 69, No. 2 (2009), pp. 409–445 (416–417, tables 1&2)
awtor Tentotwo
druhe wersije tuteje dataje
Dieses Bild des Typs Graph sollte als Vektorgrafik im SVG-Format neu erstellt werden. Vektorformate haben zahlreiche Vorteile; weitere Information unter Commons:Media for cleanup. Wenn dir eine SVG-Version dieses Bildes vorliegt, so lade diese bitte hoch. Nach dem Hochladen der Datei ist diese Vorlage auf der aktuellen Bildbeschreibungsseite durch die Vorlage {{Vector version available}}, oder kürzer {{Vva}}, zu ersetzen. Es ist empfohlen die neue SVG-Datei „European Output of Books 500–1800.svg“ zu nennen – dann benötigt die Vorlage vector version available (bzw. vva) keinen Parameter.

LaTeX source

\documentclass[border=5mm]{standalone}
\usepackage{pgfplots}
\usepackage[super]{nth}
\usepackage{amsmath}
 
 
\pgfplotstableread{
Siglos Manuscritos Libros impresos
6       13552           nan
7       10639           nan
8       43702           nan
9       201742  nan
10      135637  nan
11      212030  nan
12      768721  nan
13      1761951 nan
14      2746951 nan
%15   4999161 12589000
16       nan            217444000
17      nan             531941000
18      nan             983874000
}\datatable
 
\definecolor{RYB1}{RGB}{128, 177, 211}
\definecolor{RYB2}{RGB}{253, 180, 98}
 
\begin{document}
\begin{tikzpicture}
\begin{semilogyaxis}[
        axis on top=false, grid=both, xmajorgrids=false, every minor grid/.style=gray!20,
        axis lines*=left,
        width=12cm, height=8cm, enlarge x limits=0.05,
        ymin=1000, ymax=1e9,ytick={1000,1e4, 1e5, 1e6, 1e7, 1e8, 1e9},
        yticklabels={1000, 10\,000, 100\,000, 1\,000\,000, 10\,000\,000, 100\,000\,000, 1\,000\,000\,000},
        enlarge y limits=false,
        ybar=-10pt, xtick={6,...,18}, xticklabel={\pgfmathparse{int(\tick)}\nth{\pgfmathresult}},
        xlabel=Siglos, xlabel style={yshift=-1ex},ylabel=Número\\ de Copias,
        ylabel style={rotate=-90, align=left, anchor=east, xshift=-4ex, name=ylabel},
        after end axis/.code={
                \node [
                        font=\large\bfseries,
                        text=RYB2!60!black, fill=white, fill opacity=0.85, text opacity=1,
                        anchor=center, inner xsep=1pt]  at (axis cs:11,5e3) {Manuscritos};
                \node [
                        font=\large\bfseries, inner xsep=1pt,
                        text=RYB1!60!black,
                        fill=white, fill opacity=0.85, text opacity=1,
                        align=center, anchor=center]  at (axis cs:16.6,5e3) {Libros impresos};\
        },
        title={Producción Europea occidental de libros entre los años 500 y 1800$^{\text{\tiny{*}}}$},
        title style={font=\large\bfseries, align=center}
        ]
 
        \addplot +[fill=RYB1, draw=RYB1!50!black] table [y=Books] {\datatable};
        \addplot +[fill=RYB1, draw=RYB1!50!black, /pgf/bar shift=2.5pt] coordinates {(15,12589000)};
        \addplot +[fill=RYB2, draw=RYB2!50!black] table {\datatable};
        \addplot +[fill=RYB2, draw=RYB2!50!black, /pgf/bar shift=-2.5pt] coordinates {(15,4999161)};
        \draw (rel axis cs:0,0) -- (rel axis cs:1,0);                 
\end{semilogyaxis}
\node (annotation) at (current axis.below south west) [inner xsep=0pt, anchor=north west, align=left, font=\tiny] {$^*$without Southeast Europe (Byzantine, later Ottoman realm) and Russia};
 
\end{tikzpicture}
\end{document}

Licencowanje

Ja, awtor tutoho dźěła, wozjewjam je z tym pod slědowacej licencu:
w:hsb:Cresative Commons
připokazanje dźělić
Tuta dataja je pod licencu Creative Commons Attribution-Share Alike 3.0 Unported licencowana
Směš:
  • zhromadnje wužiwać – dźěło kopěrować, rozšěrić a dale dać
  • změšeć – zo by dźěło přiměrił
Pod slědowacymi wuměnjenjemi:
  • připokazanje – Dyrbiš informacije wo awtorstwje podać, wotkaz k icency přidać a podać, kotre změny sće přewjedł. Móžeće to na přihódne wašnje činić, ale nic tak, zo zaćišć nastawa, zo licencudawar was abo waše wužiwanje podpěruje.
  • dźělić – Jeli tute dźěło měnješ, přetworjuješ abo na njo natwarješ, móžeš hotowe dźěło jenož pod samsnej abo podobnej licencu kaž tuta rozšěrić.

Krótkowopisy

Dodaj jednolinkowy wopis tuteje dataje.

W tutej dataji zwobraznjene objekty

motiw

Wersije dataje

Klikń na wěsty čas, zo by wersiju dataje w tutym času zwobraznił.

ČasWobrazowy napohladRozeznaćeWužiwarKomentar
aktualnje22. decembra 2011, 02:41Wobrazowy napohlad za wersiju wot 22. decembra 2011, 02:411.436x953 (64 kB)TentotwoRemoved source text from image
16. decembra 2011, 03:53Wobrazowy napohlad za wersiju wot 16. decembra 2011, 03:531.455x953 (73 kB)TentotwoImproved formatting
15. decembra 2011, 00:38Wobrazowy napohlad za wersiju wot 15. decembra 2011, 00:381.260x799 (87 kB)Tentotwo

Njejsu strony, kotrež tutu dataju wužiwaja.

Globalne wužiwanje dataje

Slědowace druhe wikije wužiwaja tutón wobraz: